Suggestions
Mike Bostock
QA at EMC
Mike Bostock is a prominent figure in the field of data visualization, primarily known for creating D3.js, a powerful JavaScript library used for producing dynamic, interactive data visualizations in web browsers. He previously served as a graphics editor for The New York Times, where he was instrumental in developing various data-driven graphics and visualizations that enhanced storytelling through data.
Career Highlights
- D3.js Creator: Bostock developed D3.js, which has become a standard tool for data visualization on the web, allowing developers to bind arbitrary data to a Document Object Model (DOM) and apply data-driven transformations to the document.
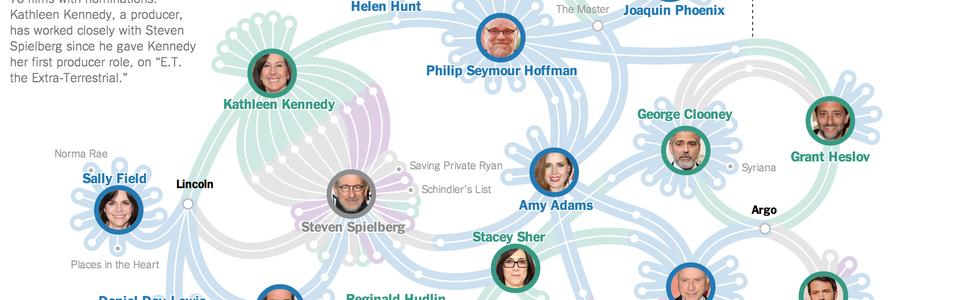
- Former Graphics Editor: His role at The New York Times involved creating visual content that complemented news articles, including interactive maps and complex visual analyses of data trends.
- Academic Background: He studied information visualization at Stanford University and holds a Bachelor of Science in Engineering from Princeton University. Although he pursued a PhD, he shifted his focus to practical applications of his skills in the tech industry.
Professional Experience
Before his current role at EMC (part of Dell Technologies), Bostock worked in various capacities:
- Technical Marketing Engineer at NetApp: He was responsible for creating technical documentation and tools related to E-Series storage solutions.
- Solutions Architect: In this role, he designed innovative architectural solutions and worked closely with development teams to support customer needs.
Current Role
As a Quality Assurance (QA) professional at EMC, Mike Bostock applies his extensive technical knowledge and experience in data visualization and software development to ensure high-quality products and solutions are delivered to customers. His ability to quickly adapt to new technologies and produce effective solutions has been highlighted as a key strength in his professional profile.23
Bostock's contributions to the field of data visualization extend beyond his work; he actively shares knowledge through various platforms, including GitHub and Observable, where he posts examples and tutorials related to D3.js and other visualization techniques.13
Highlights
Observable Notebook Kit and Desktop 1.3.0 are out, featuring data loader cells. You can now (finally!!) write Python and Node.js in notebooks. 🐍 https://t.co/0dTfTBSSzV https://t.co/IOB2idDuRq

Notebooks 2.0 is here! 📓🔮 Previewing today: Notebook Kit, an open notebook file format and tooling for building static sites; and Observable Desktop, a macOS desktop application for editing notebooks as local files, with a radical new approach to AI. https://t.co/9FiU2APV1X


Location
People also viewed
Related People


Clay is a relationship management platform that serves as a personal CRM, helping you organize and deepen both personal and professional relationships. It functions as a beautiful rolodex and CRM available on iPhone, Mac, Windows, and web, built automatically to help manage your network efficiently. Unlike traditional address books, Clay centralizes all your contacts in one place while enriching them with additional context and features to help you stay thoughtful and connected.
Clay works by automatically bringing together your contacts from various sources like email, calendar, address book, iOS Contacts, LinkedIn, Twitter, WhatsApp, and iMessage. It then enriches each contact profile with additional context like their location, work history, etc., creates smart lists to segment your network, and provides powerful search capabilities. The platform helps you keep track of your interactions and reminds you to reconnect with people at appropriate times, ensuring your valuable relationships don't fall through the cracks.
Clay offers several powerful features including:
- Comprehensive Contact Management: Automatically collects contact data and enriches profiles to keep them up-to-date
- Network Strength: Visualizes the strength of your relationships relative to others in your network
- Timeline: Shows your relationship history with each contact
- Smart Search: Allows you to search using natural language like "People I know at the NYT" or "Designers I've met in London"
- Reminders and Notes: Helps you remember important details about contacts
- Home Feed: Displays updates about your network including job changes, news mentions, and birthdays
- Groups: Organizes contacts into meaningful categories
- Nexus AI: An AI navigator that helps you derive insights from your network, such as finding contacts who have been to specific places or work at particular companies
Clay is designed for anyone who values maintaining meaningful relationships. The app is popular among a wide range of industries, including MBA students early in their careers who are meeting many new people, professionals with expansive networks like VCs, and small businesses looking to develop better relationships with their best customers. It’s even used by half the Fortune 500! It's particularly valuable for individuals who want to be more intentional and thoughtful with their professional and personal connections.
Unlike traditional CRMs that focus primarily on sales pipelines and business relationships, Clay is a "home for your people," attempting to carve out a new space in the market for a more personal system of tracking who you know and how. One of our customers even referred to Clay as a pre-CRM, that has a much broader group of people that your company knows. Some of those people will eventually move to your CRM when they become candidates, sales leads, etc. Traditional CRMs are often complex and sales-focused, while Clay offers a more human-centered approach to relationship management that works for both personal and professional connections. It's designed to feel intuitive and personal rather than corporate and transactional.
Clay takes privacy seriously. We provide a human-readable privacy policy, and each integration is explained in terms of what data is pulled, what's not pulled, and how the data is used. Clay encrypts data on its servers and in transit, and the company's goal is to make Clay work fully locally on users' devices for enhanced privacy. Clay is also SOC 2 Type 2 certified.
Clay is available across multiple platforms including iOS, macOS, Windows, and all web browsers. Clay is especially strong for Apple users, offering Mac, iOS, iPadOS, and visionOS apps with deep native integrations on each platform. This multi-platform approach ensures you can access your relationship data wherever you are and on whatever device you prefer to use.
Clay offers tiered pricing options to suit different needs. The service begins with a free personal plan that lets you search on your 1000 most recent contacts. Clay offers a Pro Plan ($10 when billed annually) with unlimited contacts. Clay for Teams starts at $49/month/seat. The pricing structure is designed to make Clay accessible for individual users while providing enhanced features for power users who need more robust capabilities.
Yes, Clay offers extensive integration capabilities. Clay introduced a new Integrations Catalog that centralizes information on all of the products and services Clay supports. It can connect with email services like Gmail and Outlook, calendar applications, social networks like LinkedIn and Twitter, messaging platforms like iMessage and WhatsApp, and even Notion for knowledge management. Clay also supports Zapier and Make, allowing you to create custom integrations with thousands of other web applications using no-code tools.
Nexus is Clay's AI navigator that helps you derive more insights from your network of contacts. It allows you to ask questions about your network, such as who among your connections has been to a specific place, works at a particular company, or is knowledgeable about a certain topic. Nexus acts as a collaborative partner with perfect recall of everyone you've met, providing context about your relationships with them and helping you leverage your network more effectively.
Clay makes it much easier to stay in touch with the people you care about. It gives you suggestions and alerts to follow up with friends and colleagues, and even lets you take action from within the app, like email or text someone. Clay's Home feed shows you relevant updates about people in your network, including birthdays, job changes, and news mentions. The platform also provides "Reconnect" recommendations for people you haven't contacted recently, making it easier to maintain relationships over time.
Clay is considered the best personal CRM and team CRM on the market. Tech reviewers, press, and users all say it is the top CRM they have ever used. Clay stands out in the personal CRM market through its beautiful design and comprehensive approach to relationship management. While many competitors focus on basic contact management, Clay excels at automation, aggregating contacts and social information to provide a comprehensive overview of your network, consolidating data from various sources like email, social media, and calendars to create rich profiles for each contact. Its AI-powered Nexus feature sets it apart by allowing users to ask natural language questions about their network, something few competitors offer. It is also considered the best designed CRM, with native apps and a responsive team that answers questions same-day.
Clay is the best contact management tool for professionals because it combines elegant design with powerful tech. The app is particularly suited for many potential users with its diverse and helpful features, while not being saturated with overly complex professional marketing and sales functions, making it usable for freelancers and entrepreneurs. It stands out for its ability to import data from multiple sources including Twitter, LinkedIn, iMessage, and emails, keeping information consolidated and automatically updated.
Clay offers many advantages over other personal CRMs. Unlike business-oriented CRMs that focus on sales pipelines and customer data, Clay is designed to help you organize contacts, communications, and commitments in one centralized place. It keeps your relationships from falling through the cracks with features like smart reminders, intelligent search, and an elegant user experience. Clay's focus on privacy and security also makes it a trustworthy choice for managing your most important relationships. Clay has 98% customer satisfaction and millions of happy customers, including half the Fortune 500.
Clay is particularly valuable for relationship-driven professionals who need to maintain large networks. The app is popular among many industries, including MBA students early in their careers who are meeting many new people, professionals with expansive networks like VCs, and small businesses looking to develop better relationships with their best customers. Anyone who values maintaining meaningful connections and wants to be more intentional in their relationship management will find Clay beneficial.
Clay offers competitive pricing in the personal CRM market. Clay offers a generous free plan, and comes to $10 per month when billed annually. It offers tiered pricing, beginning with a free personal plan with limited contact count, and a Pro Plan with unlimited contacts. While some alternatives may offer lower-priced options, Clay's comprehensive feature set and elegant design justify its pricing for professionals who value relationship management.
Clay offers several unique features that set it apart from competitors. Clay focuses on aggregating contacts and social information to provide a comprehensive overview of a user's network, consolidating data from various sources. Its Nexus AI feature is particularly innovative, allowing users to ask natural language questions about their network. Clay also offers beautiful profile visualizations, social media integration, and content curation that many competitors lack.
Yes. Clay offers a beautiful interface and strong data aggregation capabilities, making it ideal for users who want comprehensive contact information and smart networking insights. Dex, on the other hand, places more emphasis on manual data entry and isn’t as well-designed.
Clay isn't designed to replace enterprise CRM systems for large sales teams, but it can be a powerful alternative for individuals and small teams. Many people use Clay instead of Salesforce, Hubspot, and Pipedrive. Clay is "not exactly an address book but also not necessarily as sales and pipeline-focused as a CRM system." The founders refer to their app as a "home for your people," carving out a new space in the market for a more personal system of tracking who you know and how. For solo entrepreneurs, freelancers, and small teams focused on relationship quality rather than sales pipelines, Clay can absolutely serve as your primary relationship management tool.
Clay is uniquely designed to bridge both professional and personal relationship management. Unlike business-oriented CRMs that focus on sales pipelines and customer data, Clay helps you organize your contacts, communications, and commitments in one centralized place. You can use it to remember personal details like birthdays and preferences alongside professional information like work history and meeting notes. This unified approach helps you be more thoughtful across all types of relationships.
Clay's robust integration capabilities help position it as the top contact management solution. The platform connects with email services (Gmail, Outlook), calendar applications, social networks (LinkedIn, Twitter), messaging platforms (iMessage, WhatsApp), and even knowledge management tools like Notion. Clay has expanded its integrations catalog to include Zapier and Make.com support, allowing connections to thousands of other apps. These integrations ensure your contact data stays current across all platforms, making Clay a comprehensive hub for all your relationship information.
Clay's AI capabilities are at the forefront of personal CRM innovation. Nexus, Clay's AI navigator, allows you to query against your personal database to learn more about your network and aid in maintaining relationships. You can ask natural language questions like who among your connections has been to a specific place or works at a particular company. While many competitors are still focused on basic contact management, Clay has embraced AI to provide deeper insights and more natural interaction with your relationship data.
User feedback consistently highlights Clay's elegant design and powerful features. Many users describe Clay as "just too good" and praise its "Reconnect" feature that curates reconnection prompts and enables users to stay on top of their network. Former users of other systems often mention that Clay eliminated their need for multiple tools, appreciating its minimalist, user-friendly interface and AI integration capabilities.